How Do You Track Whether Your Release Notes Are Working?


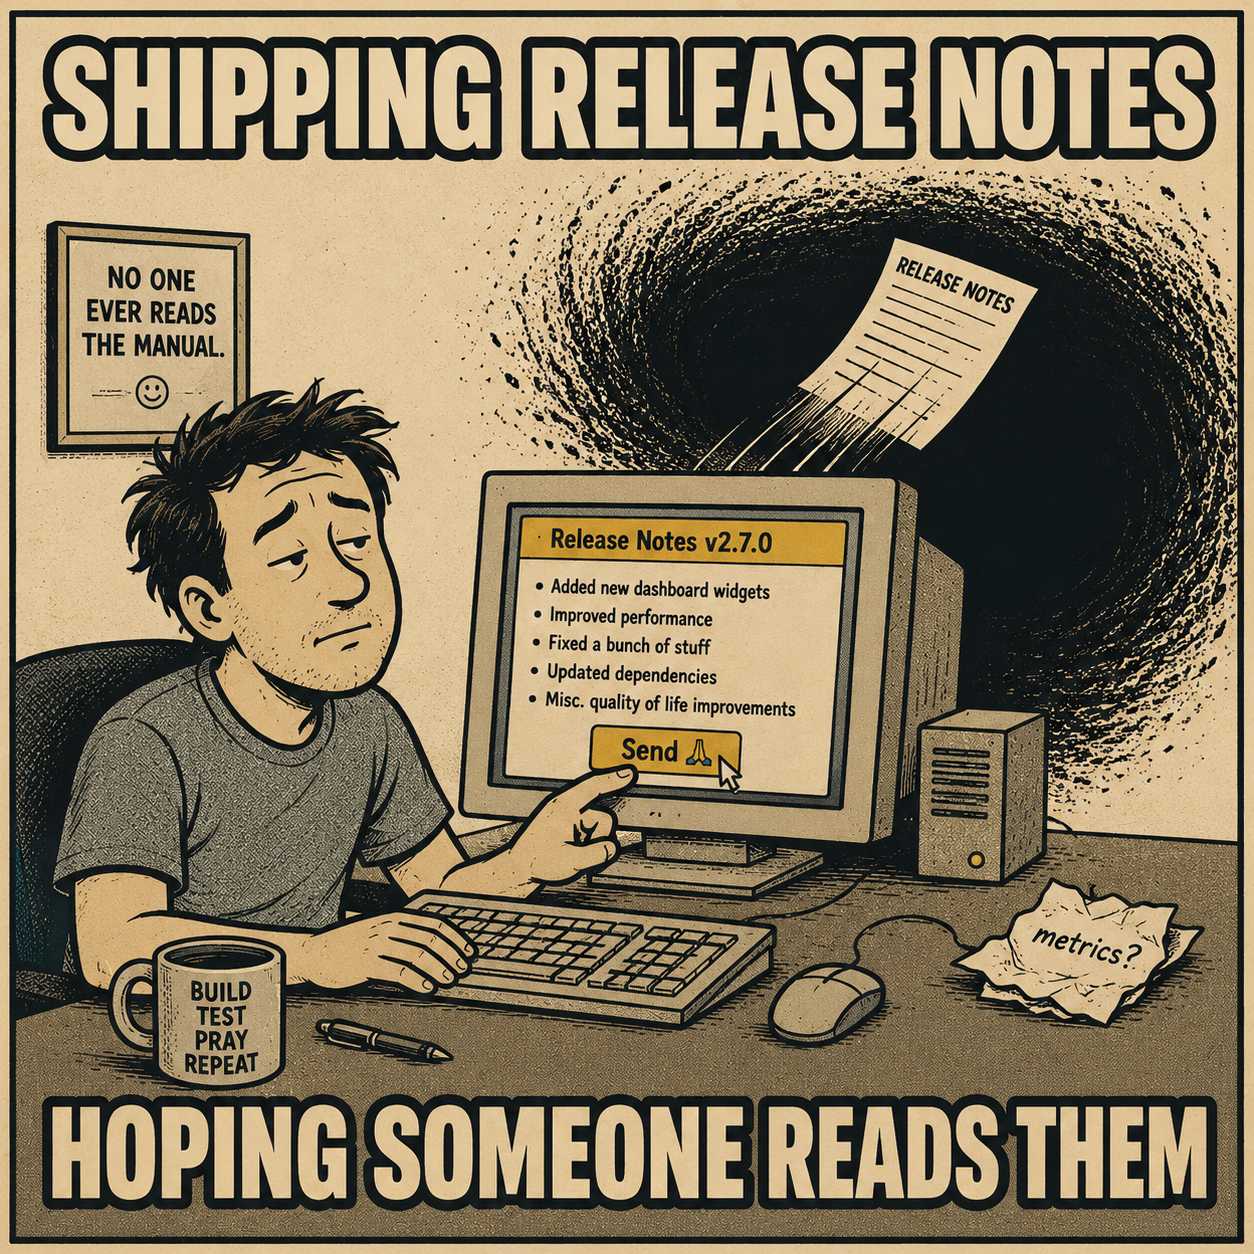
Most teams publish release notes into the void. They push the code, write the summary, hit send, and hope for the best.
They don't know if customers read them. They don't know if support tickets dropped. They don't know if adoption of new features improved, or if the executive team can even tell what shipped last quarter. "Working" is undefined. So most release notes exist in a state of permanent, unfalsifiable adequacy.
We can do better than that. But first, we have to decide what "working" actually means.
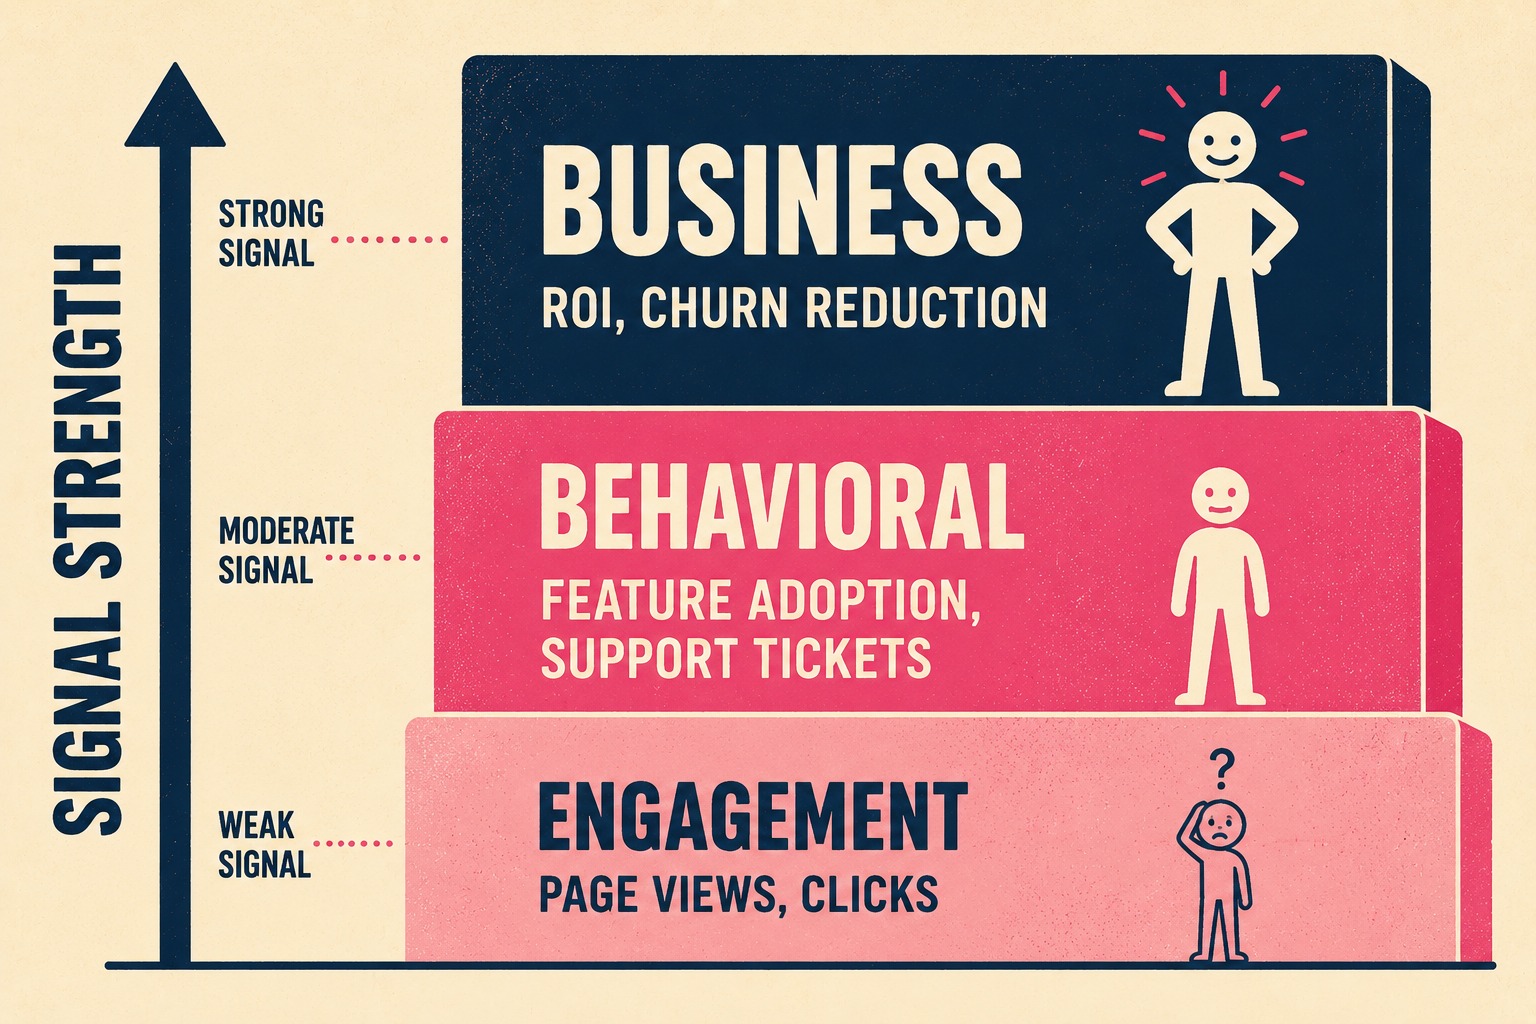
There are three tiers of metrics here, ordered by how much control you have over them.
The easiest to instrument is engagement. Page views, time on page, scroll depth, click-through to linked documentation. These are weak signals. They tell you if anyone showed up, not if it mattered. A 40% scroll depth means they skimmed. An 80% scroll depth means they read. Clicks to docs mean they acted. But it's still just engagement.
The next tier is behavioral metrics. These are harder to get, but offer a stronger signal. Feature adoption rates post-release. Reduction in "how do I use this" support tickets. A decrease in questions in community forums or Slack after a feature ships. This connects release note publication directly to downstream user behavior.
The final tier is business metrics. These are the hardest to isolate, but they offer the strongest signal. Faster time-to-value for new features. Reduced churn after major changes. Executive ability to report what shipped without asking engineering. These require cross-system attribution, but they prove ROI.
How do you actually track these things?
For engagement, you start with UTM parameters on links in email announcements. You use event tracking in analytics platforms. You put heatmaps on release note pages.
For behavior, you run cohort analysis. Compare feature adoption between users who viewed release notes and those who didn't. Tag support tickets by release version. If tickets about a feature spike after launch despite release notes, the communication failed.
Track community questions. If users ask how something works three days after you published release notes explaining it, the format or distribution is broken.
For business metrics, tie release note publication timing to feature activation curves. Did explaining the feature accelerate adoption? Track executive requests for what shipped. If leadership still asks engineering for summaries, the notes aren't reaching decision-makers. Measure time spent by product managers answering questions from sales. Release notes should reduce that load.
This is harder than it looks.
Most analytics platforms don't connect documentation consumption to product behavior by default. You need deliberate schema design. User IDs in both systems. Event tracking that spans docs and product. Cohort definitions that isolate release note readers.
Release notes also compete with other communication channels. In-app notifications, email, sales calls, community posts. Isolating their contribution requires either A/B testing (half your users get notes, half don't—measure the delta) or multivariate attribution modeling. Most teams lack the data infrastructure for either.
Small sample sizes break statistical significance, too. If only 200 users read your release notes and 150 of them adopted the feature, you can't confidently say the notes caused it without a control group.
So what do you do if you don't have a team of data scientists?
Start with email open rates and click-throughs if you send release notes via email. Pair that with feature adoption rates in the product. If opens are high but adoption is flat, the content isn't persuasive. If opens are low but adoption is strong, distribution is the problem, not writing.
Use support ticket volume as a lagging indicator. Tag tickets by release version and feature. If a feature launches and generates 50 tickets asking "how does this work," your release notes failed to preempt confusion.
Survey a sample of users who read release notes. Ask: "Did this help you understand what changed?" and "Did you try the new feature because of this note?" Qualitative feedback fills gaps that analytics miss.
Track internal metrics. How many hours does the support team spend answering "what's new" questions? How often does the executive team ask engineering for release summaries? If those numbers don't drop after you improve release notes, the format or distribution needs work.
Metrics reveal what works. If video walkthroughs in release notes correlate with higher feature adoption than text-only notes, invest in video. If long-form explanations have high bounce rates but bullet lists get read, adjust the format.
Tracking release notes isn't about justifying the writer's salary. It's about figuring out how to explain the product so people actually use it. And that's a problem you can solve systematically. AI drafts from commits, humans review in a dashboard, edge cases are flagged, and patterns are fed back. Doc Holiday gives lean teams the structure to validate, manage, and scale this output without rebuilding a large headcount.